Yield vs Capital Growth
Most online sources will tell you to always aim for Capital Growth over yield, which is generally sound advice. But there’s a lot more to it than that. High yielding properties can have significant advantages, which we’ll get to further down.
This article will look into yield vs capital growth in detail, but will more specifically be looking at ‘capital growth properties’ vs ‘high yielding properties’. Where I’d consider the capital growth properties to be more commonly found around capital cities and be negative in cashflow, whereas high yielding properties would be unusual properties and/or regional and put cash in your pocket each year.
Firstly, I'd highly recommend watching the video below if you're able. It's pretty meaty but will explain things a bit more clearly, although all the information can be read herein if preferred.
For those that have watched the video and/or are looking for the current version(s) of the calculator, here it is:
Excel: Yield vs Capital Growth Calculator - Blue Fox Finance version
Capital Growth – the compounding effect
Let’s first take a look at why Capital Growth makes so much sense by default with some extreme examples.
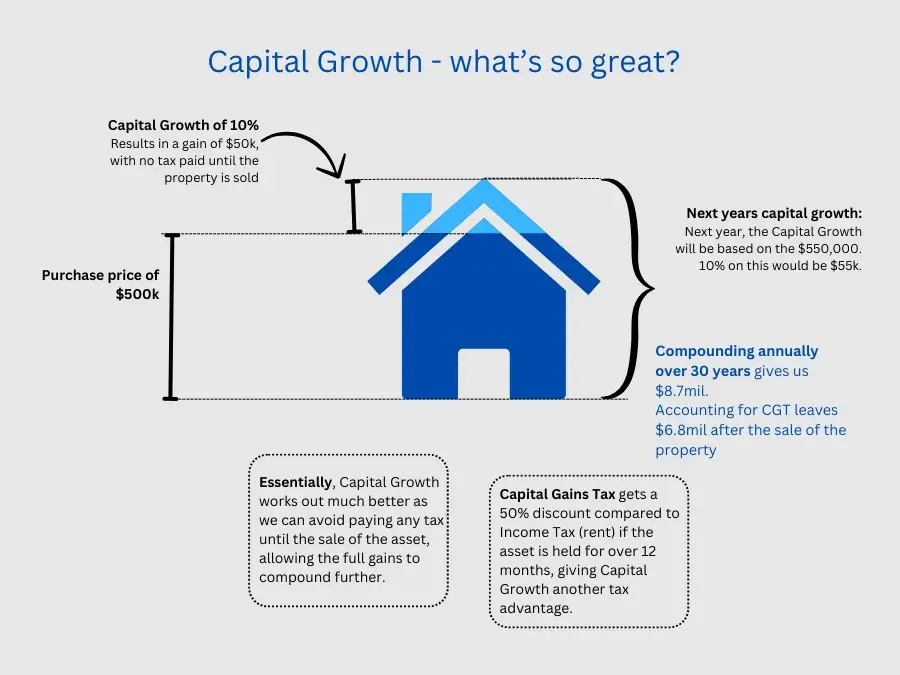
Taking the above example and compounding $500k at 10% for 30 years without paying any tax would give you a value of $8.7mil. Remove Capital Gains Tax (CGT) at a rate of 23.5% (50% of 47% due to the CGT discount) leaves $6.8mil after the sale of the property.
Note: this is a very simplistic example. 10% Capital Growth p.a. is not sustainable over a 30 year period, and we’re not factoring any holding costs among other complications.
Yield – it’s ongoing tax implications
Let’s take a look at how Rental Yield would compare in the same circumstances.
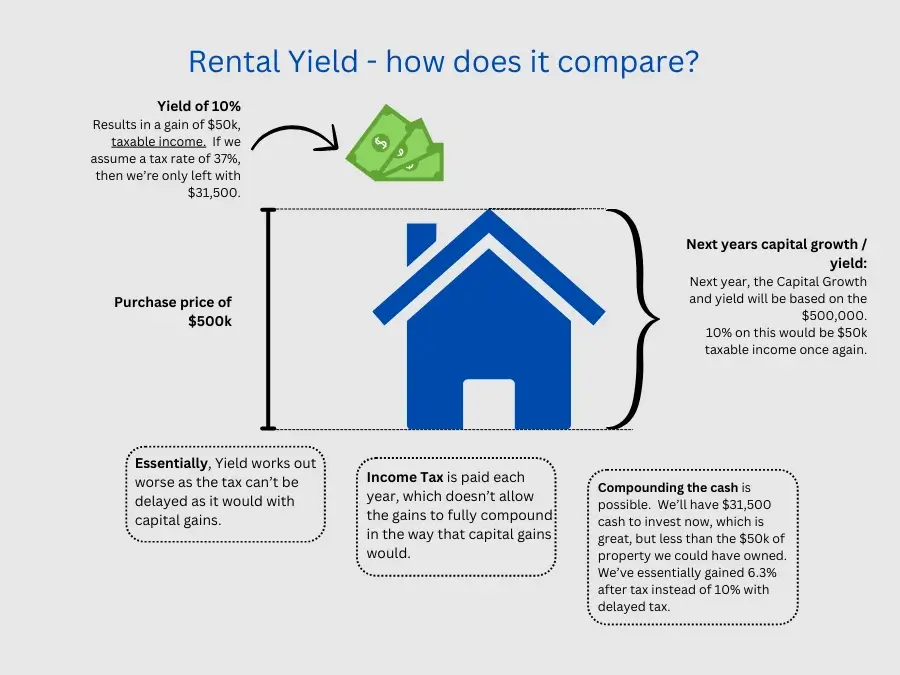
In the above example, we’re only left with $31,500 from rental income, after paying for tax at a 37% tax rate (for example).
This means we’re getting a NET return of 6.3%, but don’t have to pay CGT when we sell the property.
If we apply the 37% tax rate to the rental income each year, and reinvest whatever cash is left each year at a 10% return (to mimic the example), then we only have $3.1mil in assets at the end of the 30 year period.
Again, this is a very simplistic and extreme example ignoring a multitude of factors, but shows us that 10% capital growth can result in more than double the wealth after a 30 year period. This also shouldn’t be taken as a ‘going for a capital growth focused property will result in double the wealth’, as that’s absolutely not true either. We’ll look at some more realistic examples/calcs towards the end including both capital growth and yield.
Yield vs Capital Growth – Pros and Cons
The benefits of capital growth can’t be underestimated or ignored. Comparing one property over a long period of time and ignoring other factors, capital gains is King.
They also are usually more blue-chip properties i.e. safe properties in and around capital cities.
But almost all other benefits go to high yielding properties.
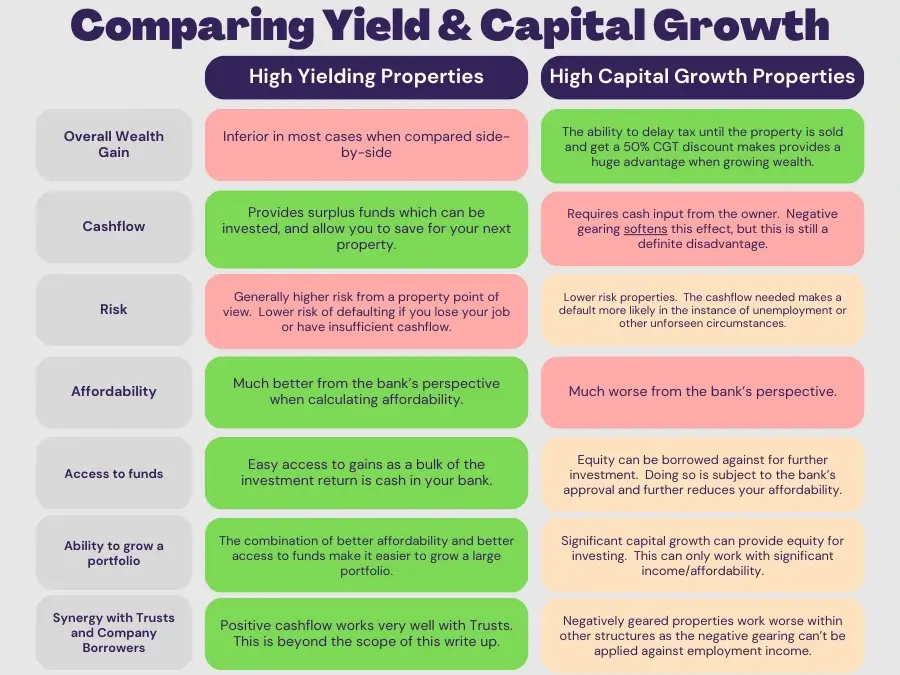
A lot of those sections may be confusing, but we’re going to break down each of them to better understand.
Before doing so, I want to touch on negative gearing. Someone is going to read the above and think ‘but what about the tax advantages of negative gearing’. Let’s make sure we’re on the same page.
How Negative Gearing fits in
Let’s first make sure we understand how negative gearing works and why it’s considered helpful.
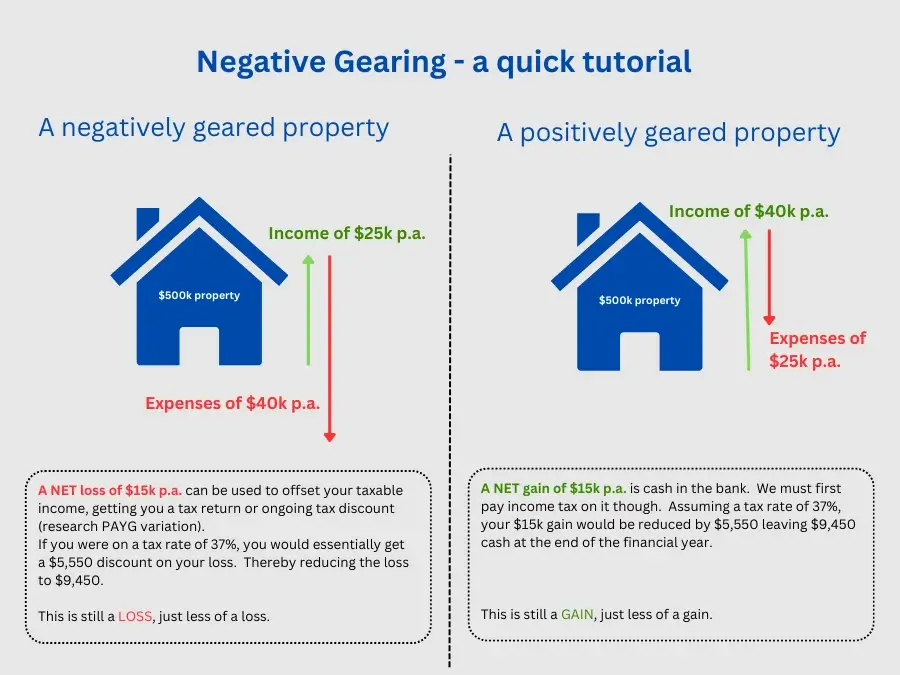
Nothing crazy here, I just want to make it clear that losing less money isn’t an advantage, it’s just offsetting your losses.
Nevertheless, when on the fence of picking a high yielding property of a high capital growth property, your effective tax rate absolutely makes a difference.
As the reduction in gain/loss is based on your tax bracket, those on the higher tax brackets do fare better with high capital growth properties, and those on a lower tax bracket will do better with cashflow properties, relative to each other. All other factors still need to be taken into consideration.
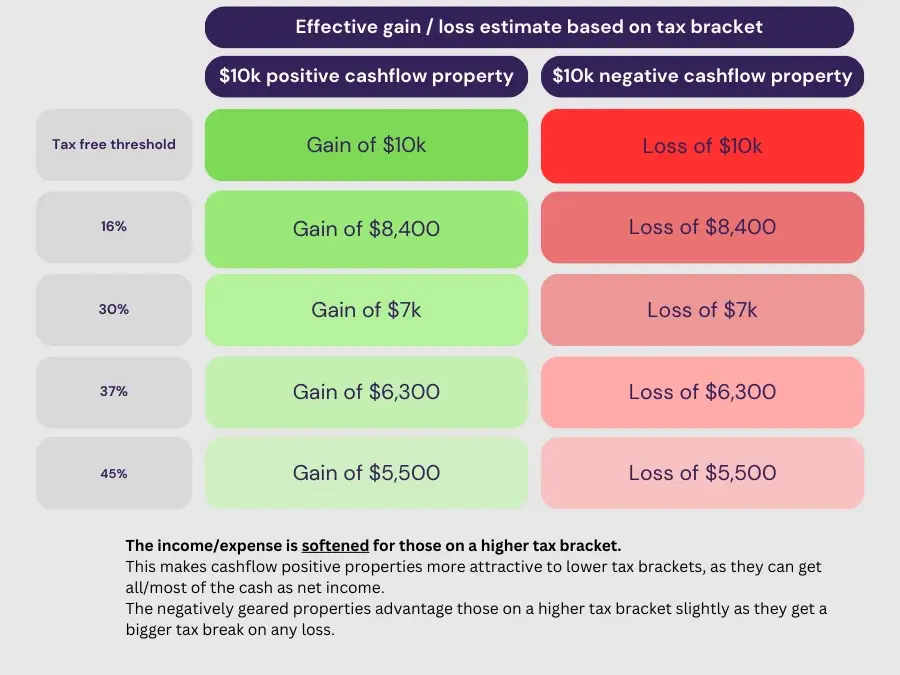
It’s important to note that I’m absolutely not saying ‘high earners should get negatively geared properties’ or vice versa. I’m just highlighting this should be a definite consideration and may be worth talking to your Accountant about.
This isn’t considered an advantage to cashflow positive properties or high growth properties, as the effects will vary depending on your current and future situation.
Trusts and Companies interact differently with negatively geared properties. Please see our article/video about Trusts for more info.
If you are using other entities and/or self-employed with a correctly setup bucket company, you may be able to cap the income tax payable to 25% or 30% which can make cash-flow properties a little more attractive.
Properties: what properties are high yield and which are high capital growth?
Let’s have a look at the below as a rough guide:
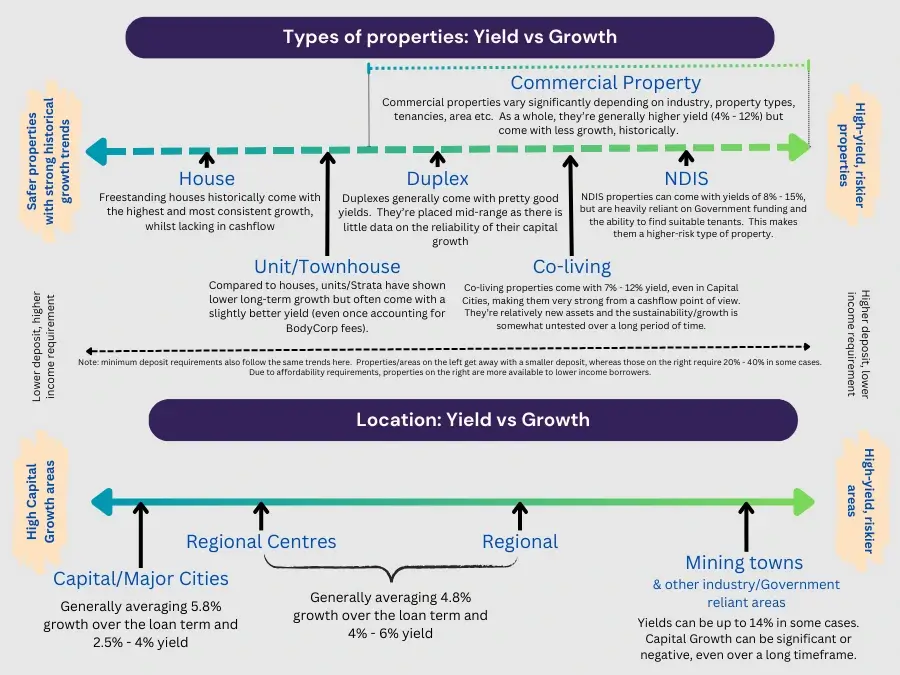
The general trend is that the higher the cashflow, the higher the risk, not necessarily lower capital growth.
If we look at a Mining Town, for example, they can far out-grow a capital city in some circumstances. But they’re high risk because they can also go backwards more regularly, and are very unlikely to outpace a capital city over a long span of time. The same goes for the high risk properties like co-living/NDIS. They may keep up/exceed other properties in capital growth, but are relatively untested and reliant on other factors, making them a higher risk option.
And with that in mind, there is also a higher risk that the cashflow decreases, but generally they will perform reasonably well in that department for their price point, even if there’s a dip.
I’ve separated it out into property type and property location, as these things are somewhat independent.
Types of Properties: Yield vs Risk/Growth
- A house, or a freestanding dwelling: historically having better growth than any other type of property and generally considered a very safe investment over a long enough period of time. They are, however, a very low yielding asset as they have no improvements to increase cashflow. The yield is heavily dependent on the location. Established dwellings on a decent block of land have a better history of growth when compared to a new build.
- Units/Apartments/Townhouses: historically have lower growth when compared with a freestanding house, but generally have a slightly higher rental return even when factoring in the additional BodyCorp expense. They also have a lower entry requirement due to the lower cost.
- Duplexes: Overall I think a solid investment in many cases. They provide additional cashflow when compared to the safer assets. I would only consider them higher risk as it’s very difficult to find any long term statistics on how their growth compares to similar assets (I couldn’t find anything). They’re also a giant pain to actually purchase due to the scarcity and lack of recent sales to compare to.
- Co-living: these are properties built for 4 – 6 people to live in, each with their own locked-off area i.e. small lounge, bedroom and kitchenette. Somewhat like building a hallway in the middle of a house and attaching 5 studio apartments to it. These make a lot of sense to me and I can understand why people want to live there, as it provides privacy/independence at a reasonable price point. From an investment perspective, they provide yields of around 7% - 12% depending on the area. These are relatively new assets meaning it’s hard to see how they’ll perform in the long run, making them a riskier choice. Note: these come with a higher initial capital requirement. The properties are more expensive and require 20% deposit.
- NDIS: properties purpose-built to house NDIS recipients. They yield 8% - 15%, which can make them very lucrative (although they do have extra costs). My issue with these properties is that they’re heavily reliant on NDIS funding, which provides uncertainty on their reliability in the future. Note: these come with a higher initial capital requirement. The properties are more expensive and require 20% deposit.
Special mentions to:
- Granny Flats: where you put a second dwelling on a block of land to rent it out, increasing the income by 50% - 100%. These make a lot of sense to me, although my personal issues with them are:
- Effort: finding a property suitable and then managing the construction of it is a huge time sink.
- Overcapitalisation: I find that the suitable properties sometimes go for a premium, which I would guess is a result of other investors looking to do the same thing. People then often overcapitalize on the build itself i.e. spending $200k for a build which only values for $150k extra. This ties up capital and also indicates that you may not get a full return on those spent funds when you sell. This all makes a bit of sense as putting a Granny Flat on the property turns it into a more specialized asset, reducing the available buyer pool when you sell.
- Construction or new builds: These generally compare with houses however historically have lower growth rates, and similar yields. The advantage they hold is that they have a large depreciation expense which can help offset your taxable income, increasing your cashflow that way.
- Off-the-plan: High risk, high reward. You could buy a property for $400k now, and not have to actually pay for the property or holding costs for another 12 months. This means that in 12 months, you may be paying $400k for a $450k asset. But likewise, you could be paying $400k for a $350k asset and/or be unable to secure finance in 12 months, leading to a loss of your deposit and/or other costs.
Location: Yield vs Risk/Growth
- Capital/Major Cities: These are always likely to be highly sought after locations, making them a generally safe investment. They also have performed well historically, averaging 5.8% capital growth. They do, however, come with lower yields of around 2.5% - 5% depending on the location.
- Regional Centers: Examples: Rockhampton, Cairns, Albury. These are well established communities with decent population sizes and all amenities, making it very likely they’ll continue to be a desirable location to live. They generally yield slightly higher than the major cities.
- Regional: these are the regional towns with lower population density. They haven’t exhibited as strong capital growth as places with bigger populations, presumably due to the lower competition in the market. Some places can get yields of 5% - 7%.
- Mining Towns and/or other places heavily reliant on industry/government funding: a lot of the population usually rents in these places as they’re there for work or another reason, this puts more competition on the rental market, and less on the buying market, leading to high yields. These can yield 8% - 15% but come with serious risks due to their reliance on other factors. If the work dries up there or the source of the income stops, then property prices can drop heavily in a short period of time. Some of these areas haven’t shown any capital growth even over a 10 – 20 year period.
Putting location & property type together
Putting it all together, we can see a few trends emerge:
- Those low-risk properties with a low yield generally have a higher price-point, however have a lower deposit requirement from the banks (due to being a lower-risk property). This means you may need less capital to buy $1mil worth of Real Estate in Brisbane (12% deposit is a solid starting point for this aka $120k + costs) than you would buying $1mil worth of Real Estate in a mining town (20% is usually required aka $200k + costs). Likewise NDIS/Co-living generally need a 20% deposit.
- Those struggling with affordability will have higher borrowing capacity purchasing the high yielding properties, as the income is factored in by the bank.
- Your risk appetite needs to be strongly considered before making choices. A co-living property in a mining town may result in astronomical rental income and growth, all things going well. Likewise it could also spell disaster due to it being a very specialized/untested property in a high-risk area.
- Entry capital needs to be considered. Generally those low on capital but looking for a relatively safe investment look to the Regional Centers. $500k is generally sufficient to purchase a solid freestanding dwelling and the banks will allow a 12% deposit to get started. Mining towns may be only $300k, but require 20% deposit.
- Most buyer’s agents and investors I deal with are generally looking at freestanding dwellings in Regional Centers. This seems to be a pretty solid strategy at the moment providing safety and hopes of capital growth that exceeds the major cities (which happens often if the location is chosen with care). It also allows a reasonable entry point without saving $300k to purchase a property near Sydney. In saying this, I’ve seen very successful investors using literally all of these property types, in all of these types of locations – so I think anything can work.
Accessing capital
A lot of people seek capital growth as they can access the equity without paying tax, hence allowing access to more capital for future investment when comp ared to cashflow.
This is true, but comes with a lot of caveats.
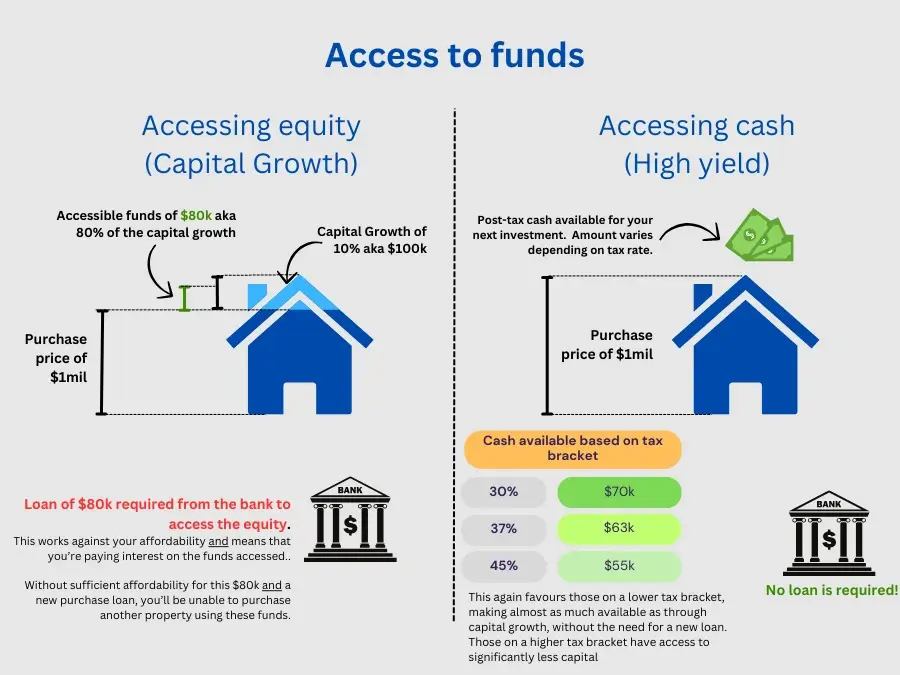
If we take the above example, we can see that the property relying on capital growth has access to more capital for future investment: $80k available in equity via a bank loan vs $55k - $70k in cash.
This can mean you can grow your investments quicker.
Using cashflow becomes worse, the higher your tax bracket.
But, to access that equity, you need to borrow the funds for your next property:
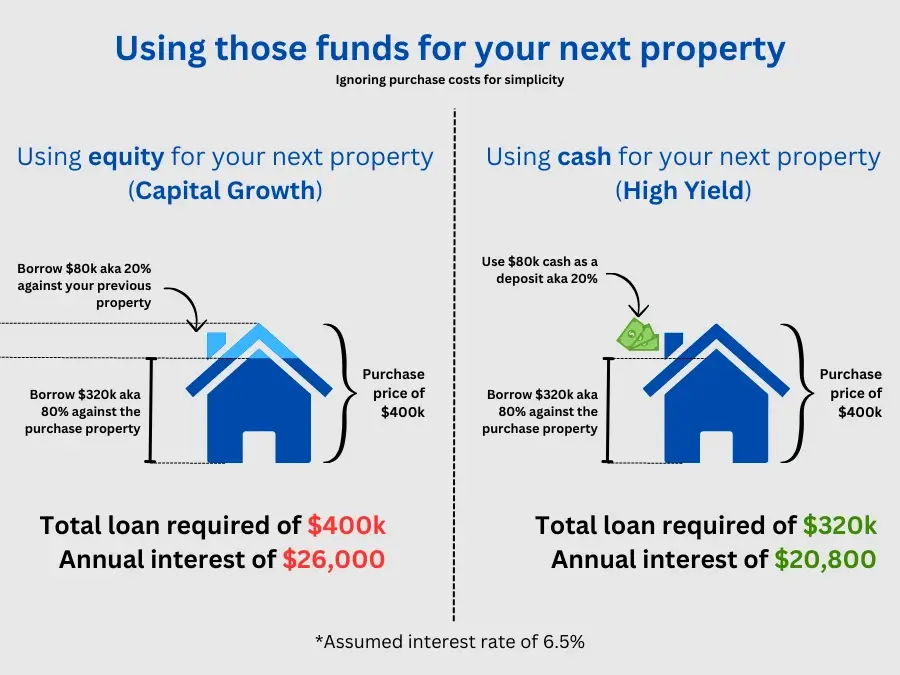
You can see the two above disadvantages of using equity to purchase the next property:
- You need additional affordability to borrow 100% of your next property price. With the lower cashflow also, this makes the affordability issues with focusing on growth further exacerbated.
- Your next property will be more cash-flow negative as you’re borrowing 100% of the purchase price, further worsening your cashflow position.
Much like other pros/cons, using equity/capital growth favours those with large income / affordability; whereas using cashflow favours those on a lower income.
Ability to grow a portfolio
As you can see, focusing solely on capital growth will hurt your affordability a lot, and make it more difficult to access capital for your next purchase.
On a high income, using equity can assist in building a portfolio faster.
Using cashflow-positive properties will allow you to purchase more properties in total.
Synergies with Trusts/Companies
Negatively geared properties don’t fare well in Trusts. The negative gearing can’t be used to offset your regular taxable income, and instead becomes a ‘loss’ which can be taken forward to further years. Essentially delaying the benefit, which is costly from an investment point of view.
Cash-flow positive properties work great with Trusts. They can be used to maintain affordability under current rules, distribute cash to a lower bracket, and be used with bucket companies given sufficient cashflow.
These are all complex concepts which I can’t cover here, but please have a look here if you’d like to learn more:
- Purchasing properties within a Trust
- Trust vs Company (not available yet)
- Cashflow within Trusts/Companies (not available yet)
- Bucket Companies (not available yet)
How does 1% Yield compare to 1% Capital Growth
We’ve probably covered enough theory, so I’m going to go through some actual figures now to allow us to better compare options.
I’m using a calculator I created for most calculations along with actual bank affordability calculators: yield vs capital growth calculator. I’ll go through the calculator in detail in the video at the top of this article, but what you need to know right now (feel free to skip this if you don’t care for the technicalities):
- It’s never going to be accurate. It’s an impossible equation with too many unknowns and assumptions, but I’ve done my best to give us a fair unbiased comparison.
- Average interest rate assumed of 6.5% for the entire It’s assumed that 80% of the initial purchase price is borrowed and on interest-only for the entire period (i.e. it never changes).
- Rental income increases at 3% p.a. which is roughly inline with inflation and long-term trends. Average rental growth over the past 23 years is about 2.50% - 3.50%. Over the past 50 years, about 5.19%. This will mean that yields are trending down over the period, which is historically accurate. (Source 1, Source 2). Rental income is taxed at the appropriate tax rate each year and ‘reinvested’.
- Land Tax is ignored. Property expenses are at $5k + 15% of the rental income. There’s no accurate formula here but this appeared to work out reasonably inline with what I see in the real world.
- Cash is re-invested at 10% p.a. It can be used to reinvest into real estate or put into the S&P 500 and average >10% in the long-run. The 10% return on investment is taxed fully at the appropriate tax rate (realistically, this wouldn’t be the case as you’d likely hold shares/property to avoid tax for a while). This giving us an effective ROI of around 6.3% (on a 37% tax rate). Alternatively you could think that it’s put into an offset against a PPOR to save 6.3%, it’s all the same – but the figure seems fair. In real life, putting your cash into a 5% savings account will make the cashflow-positive results much worse, but we’re assuming things are invested relatively aggressively for these case studies.
- Cash lost is first discounted by the tax rate to mimic negative gearing. e. if a property loses $10k on a 30% tax-rate, the negative cash balance at the end of the year would be $7k.
- Negative cash-balances (i.e. for negatively geared properties) at the end of the year are also taxed. e. a loss of $10k would be considered a loss of $13k on a 30% tax rate. This is because it’s a ‘loss of opportunity’ cost. If you need to pay $10k into a property due to the negative gearing effect.
- The ‘exit’ is calculated by summing all cash balances available (tax already paid) and the estimated sale price less CGT. CGT is always calculated at 45% less a 50% discount. I’ve done this as a large sale will almost always push you to the highest tax bracket. Stamp Duty on the purchase is estimated. Sale costs are disregarded as negligible.
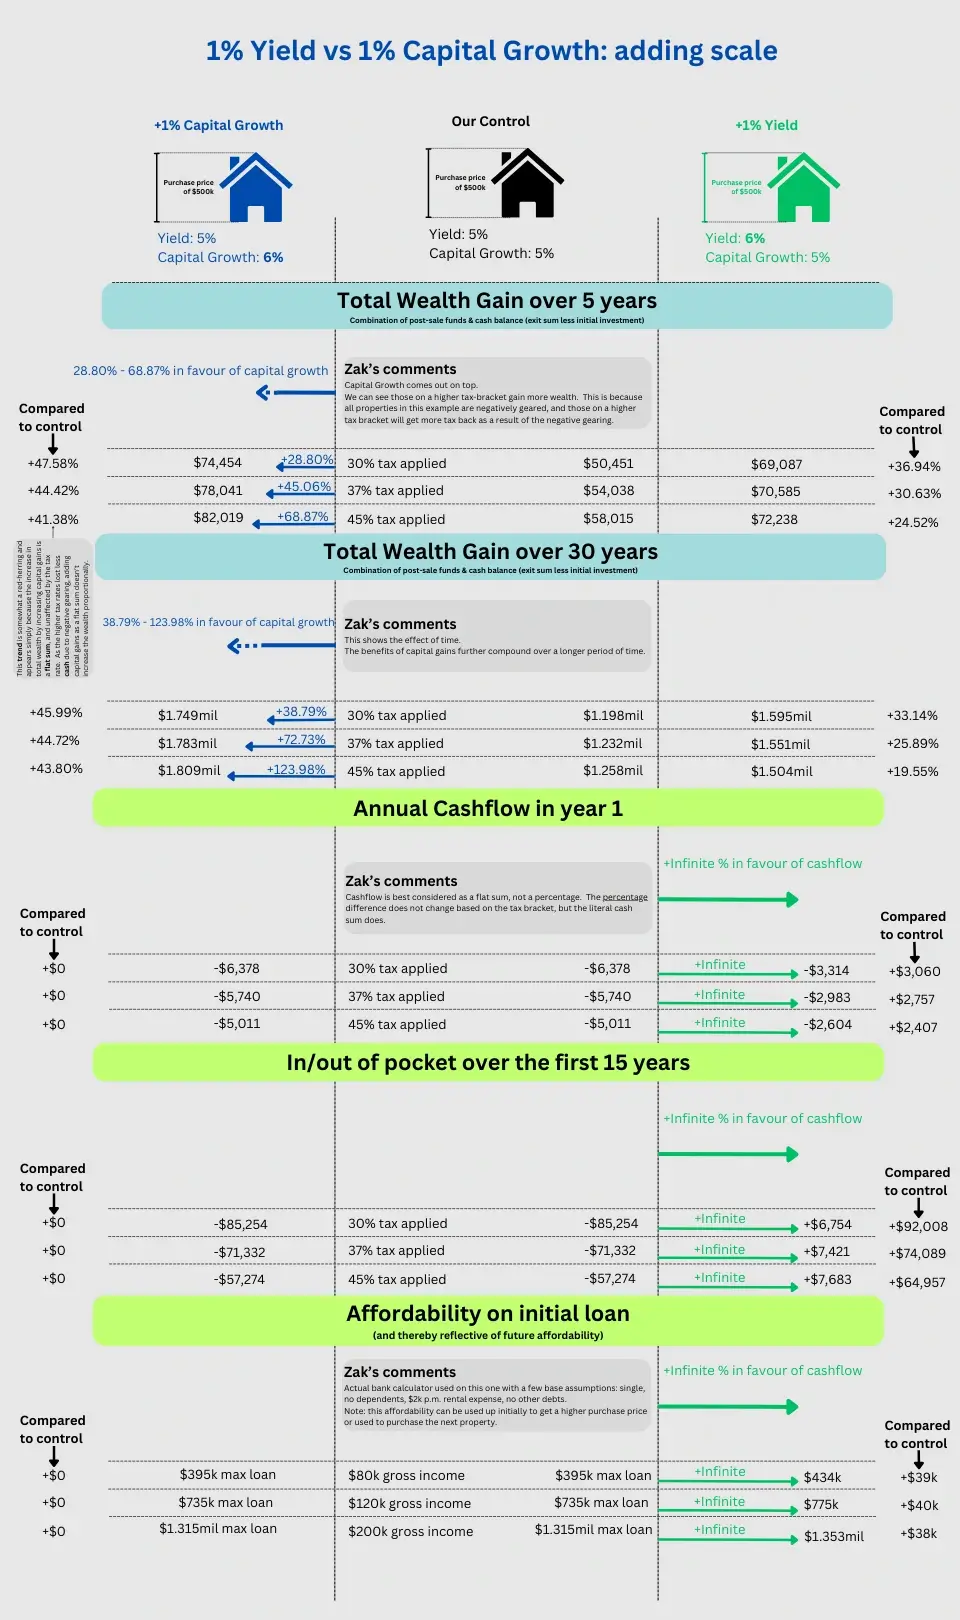
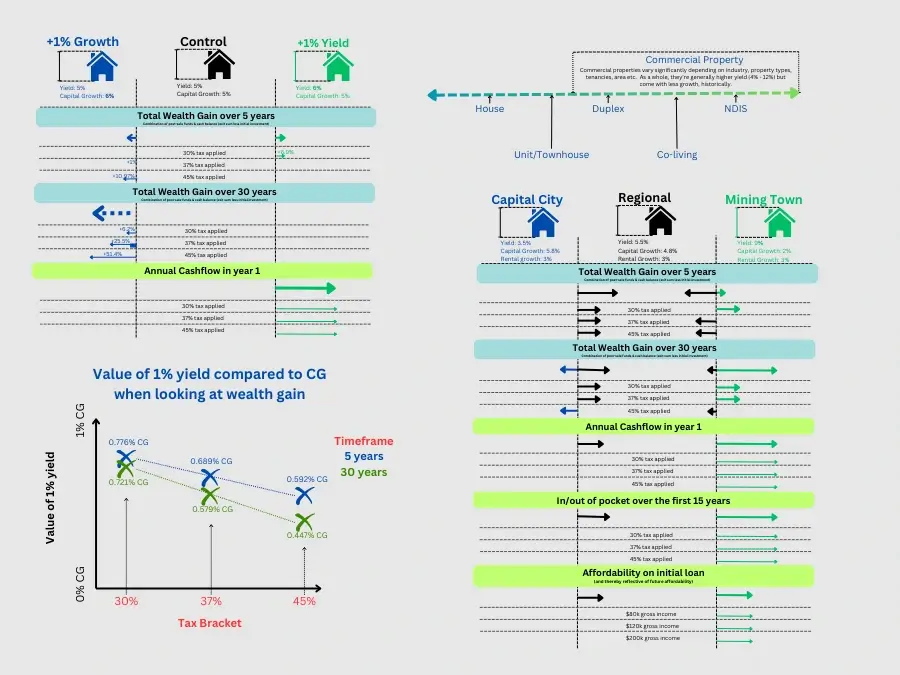
Given the choice two otherwise identical properties where one gives 1% additional growth, and the other provides 1% yield, here’s what we can see:
- The capital growth is always better for overall wealth gain
- The concessions to enable this additional wealth gain are:
- You’re out of pocket additional funds each year. In our example, that’s $92k out-of-pocket over a 15 year period
- Your affordability reduces by about $40k.
Which means we can now make an attempt to quantify how 1% yield compares to 1% capital growth from exclusively a wealth-gain point of view.
Capital gains is performing 28.80% to 123.98% better when compared to yield, with the varying factors:
- Capital Gains performs better over a longer period of time
- Capital gain performs better at a higher tax bracket
- A higher return on cash will skew these figures in favour of cashflow (figures not tested). We’ve used 10% gross return aka 5.5% - 7% net return on cash. Most people can just put the cash into a PPOR offset account to mimic this net return.
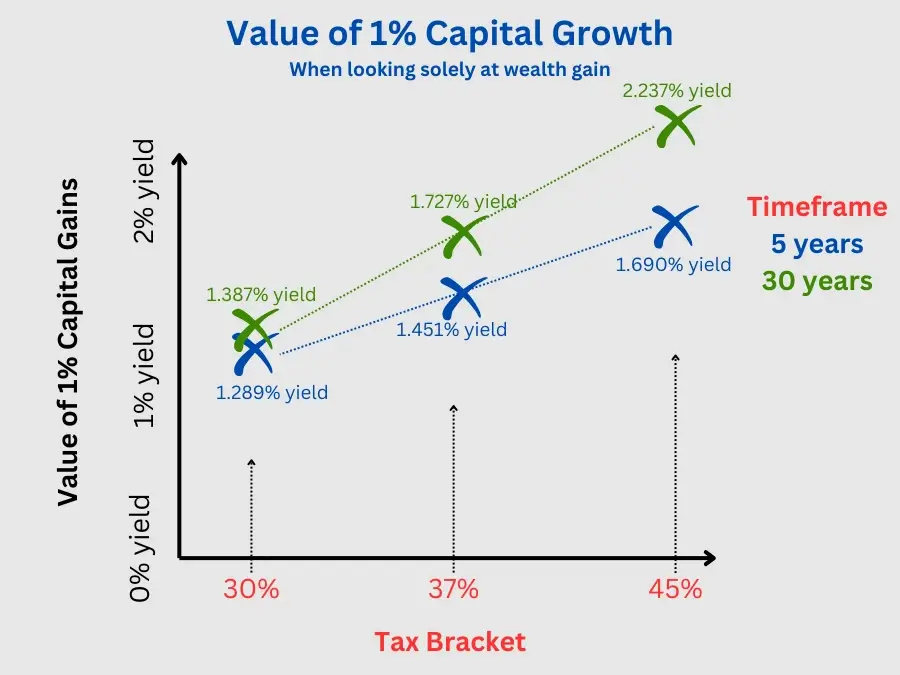
We can then figure out the figures above to give us an estimated figure of what 1% capital gains is equivalent to from a wealth-gain perspective.
This does not factor in the additional borrowing capacity that comes from the higher yielding property, so may be a good benchmark for investors that do not need the additional borrowing capacity.
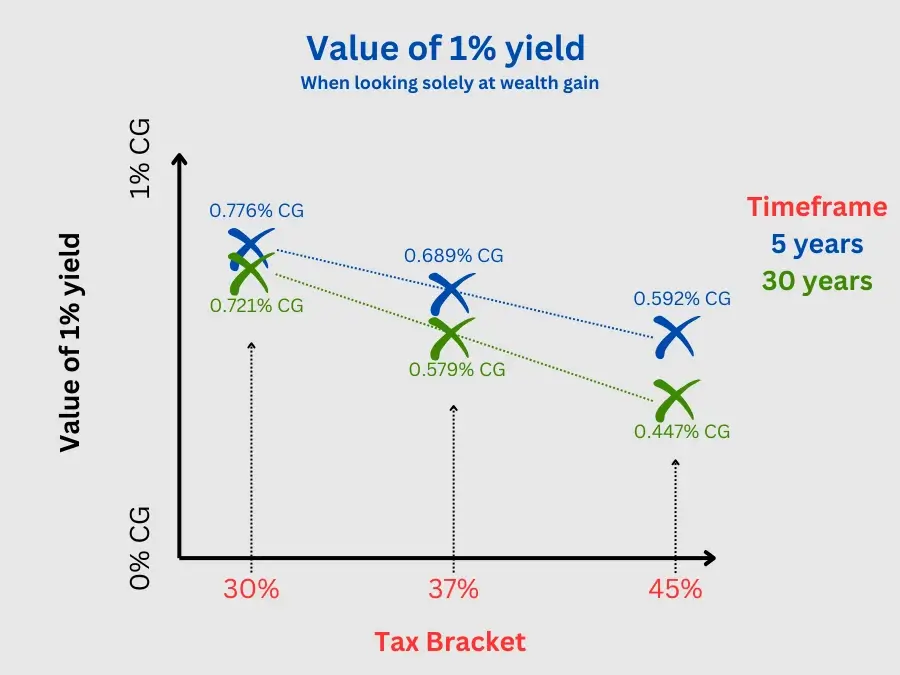
Inversing these figures lets us estimate that 1% yield is the equivalent (from a wealth point of view) to 0.447% - 0.776% capital growth.
Note: both the above graphs show the exact same information, they’re just inversed to help provide better reference points.
Adding the other benefits of cashflow make it a little more valuable than those figures, but that’s hard to quantify and depends on your personal circumstances.
It should also be noted that I re-did all these calculations where the ongoing interest rate was the varying factor. The overall wealth-gain changed significantly, but the trends did not, hence I haven’t included those figures.
There’s one more factor I’d like to test for, and that’s applying the affordability.
In this example, the +1% yield option can borrow $40k more funds.
Let’s re-do our calculations assuming that the borrower uses equity elsewhere to borrow an extra $40k, thereby increasing the property purchase price by $40k.
This is my best attempt at factoring in the power the additional borrowing capacity provides, whether used on this property (as is done in this example) or the next property:
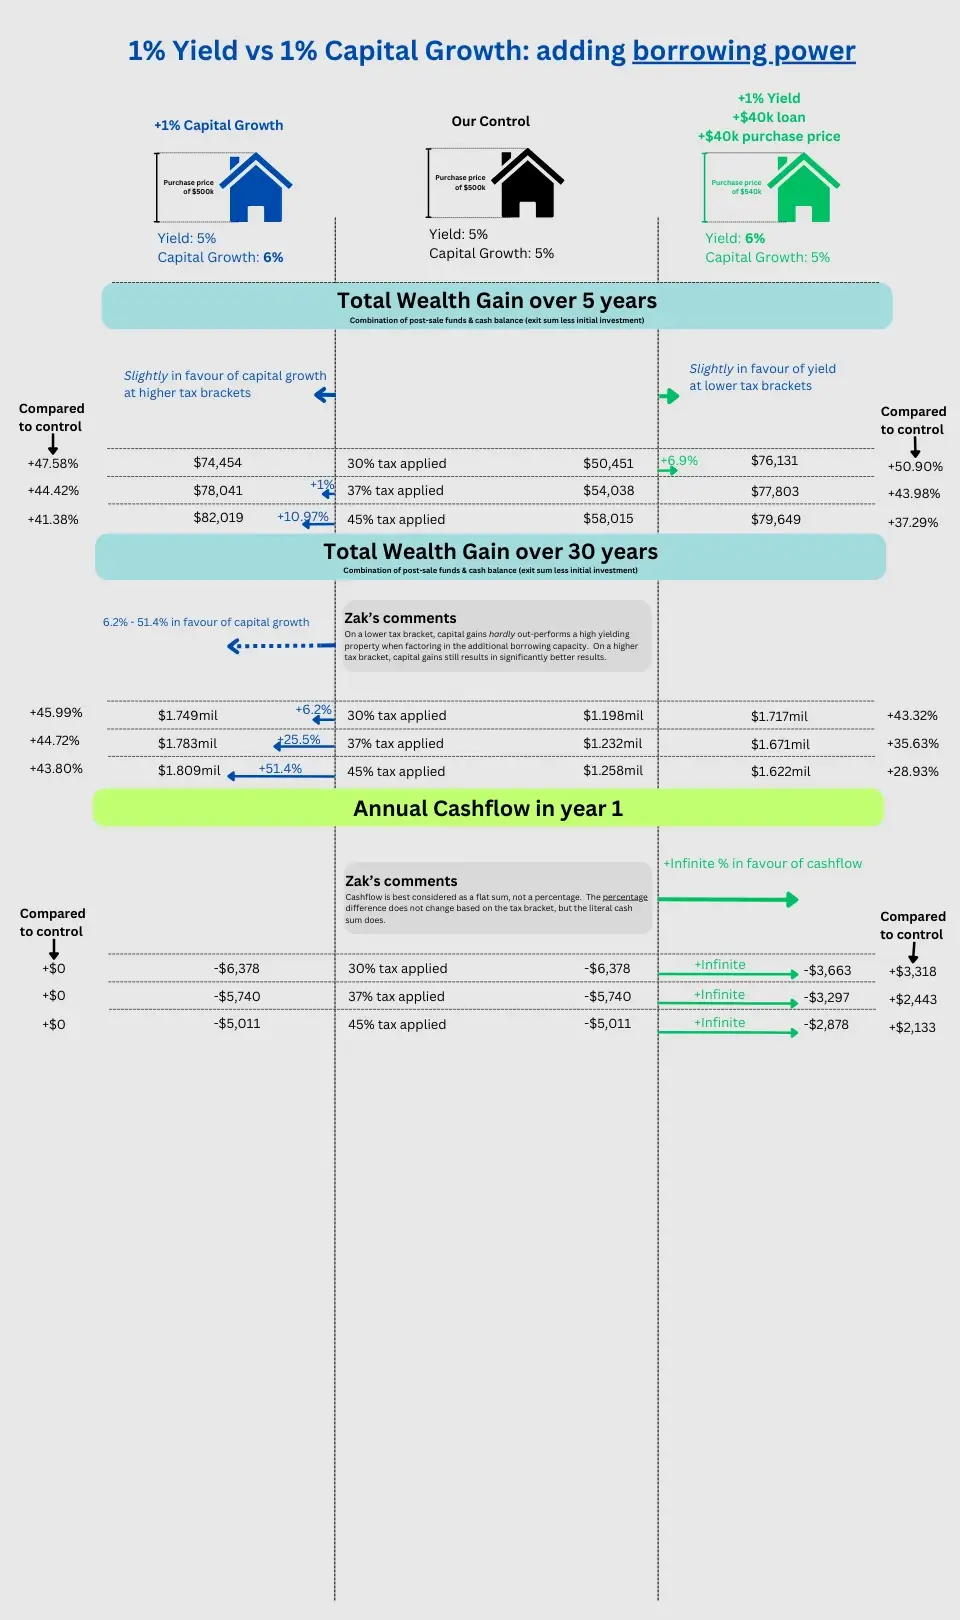
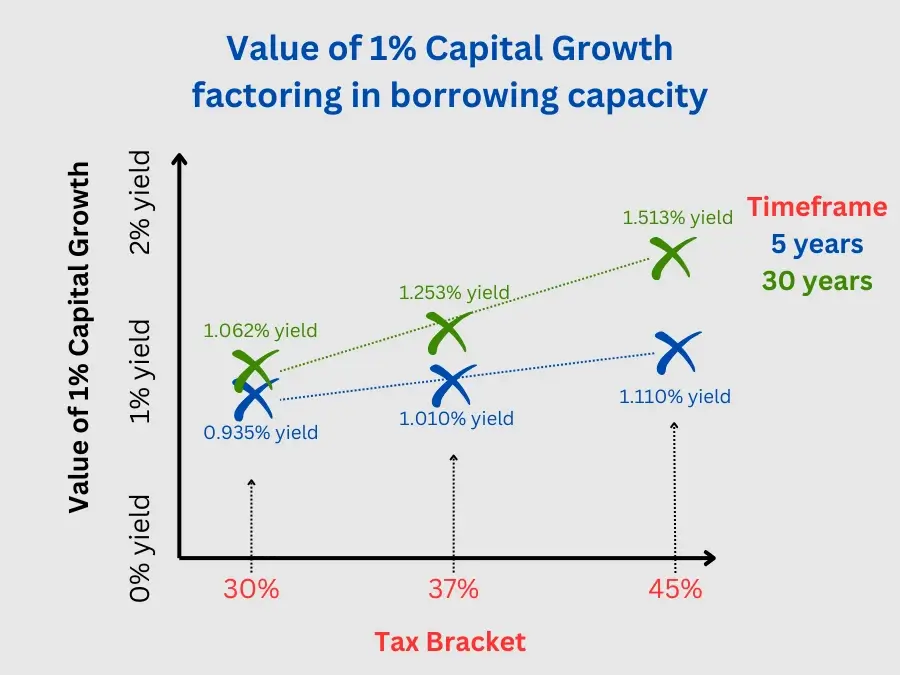
This gives us these overall equivalency values.
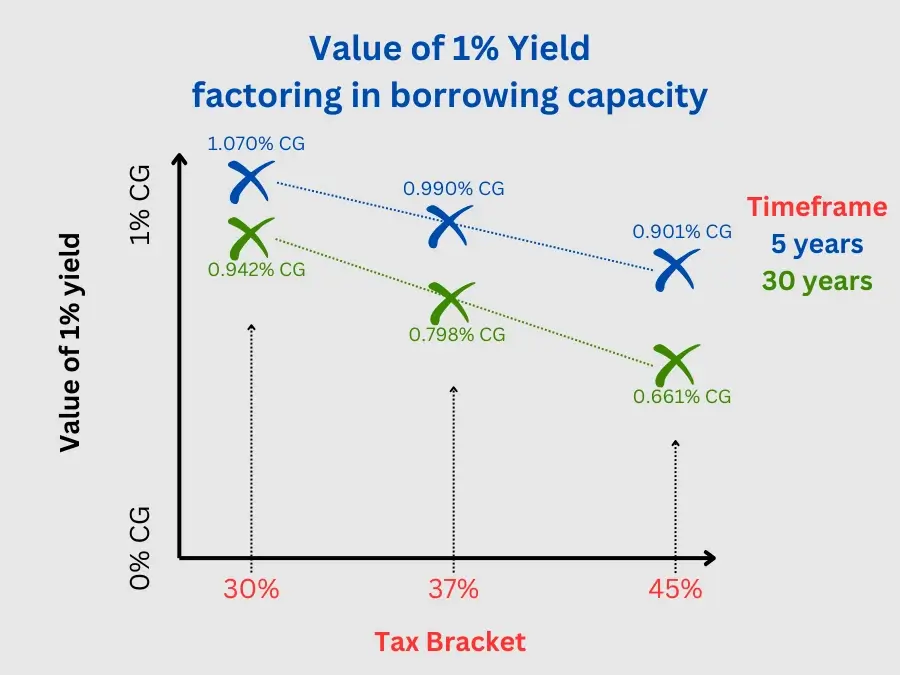
If borrowing capacity is not an issue or you don’t plan to leverage to your limit (avoiding risk), then this graph becomes irrelevant, and you should refer to the earlier figures.
However if you need that borrowing capacity to get a more expensive property now or to assist in your next property, then yield becomes much more relevant.
A few takeaways here assuming that the extra borrowing capacity is effectively used:
- Over a short period of time, 1% yield may actually outperform 1% capital growth at lower tax brackets, whilst retaining most of the cashflow benefits.
- Over a long period of time, capital gains still comes out significantly ahead on the higher tax brackets.
- If you save the $40k borrowing capacity instead for the next property, it would affect the numbers:
- The initial benefits of the yield will be decreased (should reflect the graph earlier where the $40k borrowing capacity wasn’t utilized).
- The long-term benefits should be increased assuming the next property (once leveraged) returns more than 10% p.a. gross ROI
Real World Example of high growth properties vs high yield
One last thing, then we’ll draw our overall conclusions and wrap this up.
Let’s compare 3 real-ish world properties here to see how the compare.
We’ll use:
- Capital City: assumed long-term growth of 5.8% per the historical average. Current yield of 3.5%.
- Regional property: assumed long-term growth of 4.8% per the historical average. Current yield of 5.5%. This yield is arguably a bit on the high side over a long period of time, but isn’t unreasonable.
- Mining town: let’s look at 9% yield but only 2% capital growth. The real-life growth will vary significantly (as will the yield), but lets assume it tracks with inflation. The real issue with this is being sure of anything being consistent in these areas for a 30 year period, but we can roll with it.
In all situations, rental income increases by 3% p.a. inline with inflation, and does not increase with the capital growth. This again copies historical trends.
We will show the additional borrowing capacity generated, but not factor it into our end results.
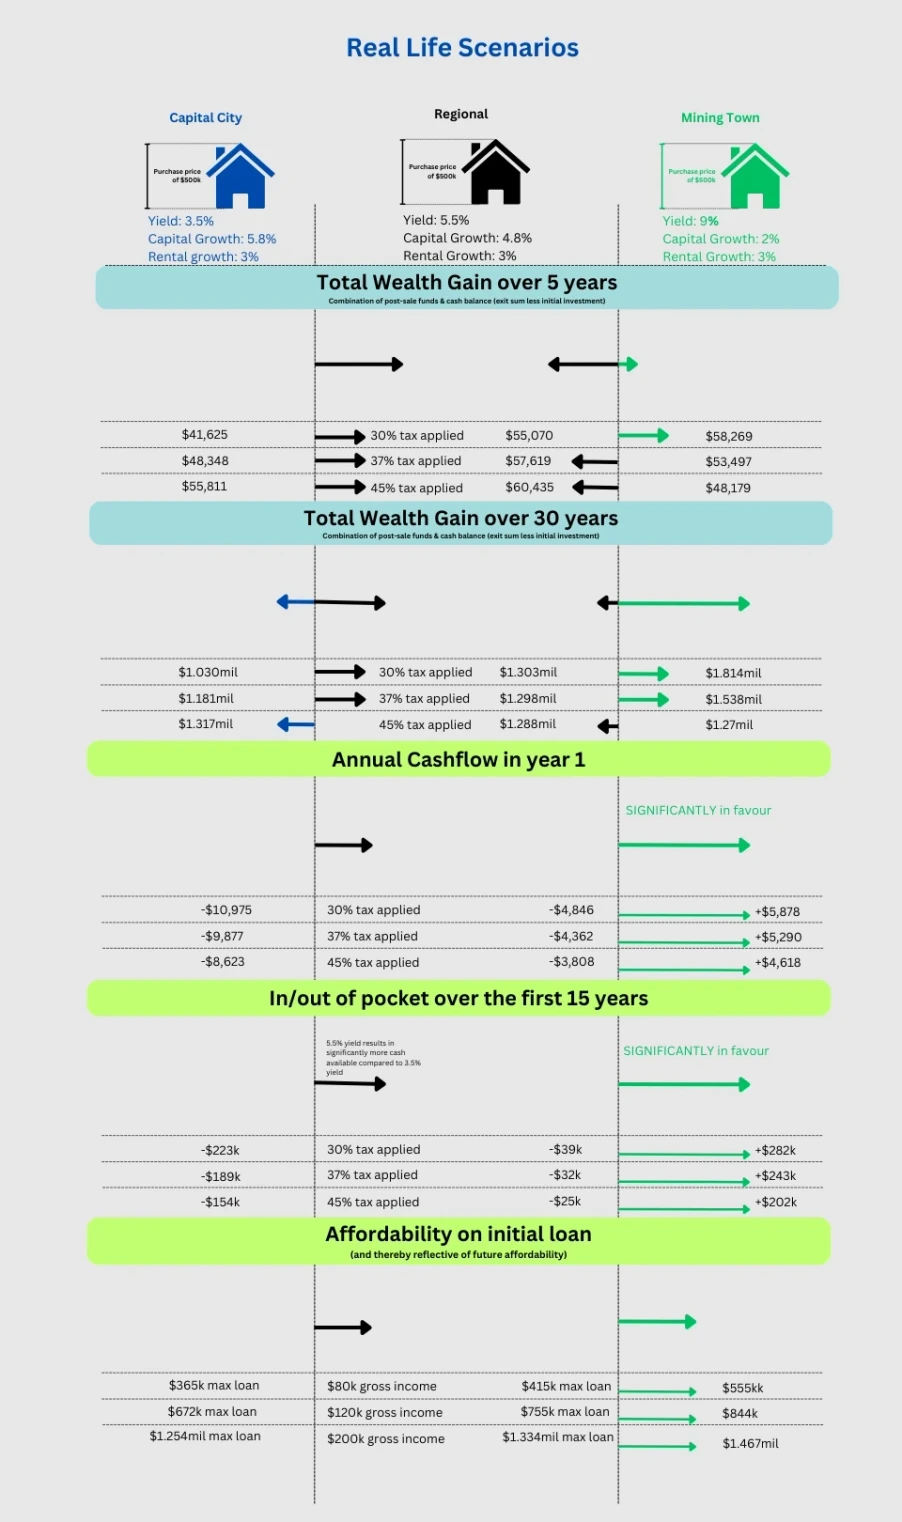
The results aren’t hugely surprising:
- Capital Cities offer the best wealth gain over a long period of time for those on a high income bracket, regardless of their low rental returns.
- Regional Properties: it’s no wonder most investors are looking at these assets recently. They perform well in all metrics despite the lower long-term growth and provide safety when compared to the riskier properties.
- Mining towns or other high-risk, high yield properties: they actually perform fantastically in all aspects, even overall wealth growth. The risk here is getting a property/location that will consistently provide high rental returns and 2% capital growth over a long period of time.
Summary of Findings
We can draw some very basic conclusions from these calculators:
- 1% capital growth is roughly the equivalent of 1% - 2.2% yield, depending on a number of factors
- The biggest gains come from choosing a property that exibits better than average stats (capital growth or yield) over your investment horizon. Comparing otherwise identical properties, adding 1% yield or growth over a 30 year period can result in additional returns of 30% - 40%.
- All tested properties appear viable over the long run. All exibiting similar gains on the numbers tested. Risk was a major factor, with some options providing greater cashflow in return for a much riskier investment (running the risk of losing wealth over a long run).
- Higher capital growth properties provide better ROI for those in a higher tax-bracket, which may make them a better choice due to the safety of the property/location and overall better returns in the long run. This seems to make sense if you can’t sustain the negative cashflow and don’t need the extra borrowing capacity.
- Strong cashflow-focused properties provide additional benefits for those on lower tax-brackets (when compared to the same property for a high-tax bracket investor), so may be a consideration. The types of properties that produce this effect vary, so additional research should be completed. We did our figures on ‘mining towns’ but Commercial, NDIS & Co-living properties can all be considered.
- Regional Properties appear to be an excellent mid-ground for all investors: providing relative safety in the asset, whilst performing very well on all fronts. These would seem to be a good backbone for any mid-large portfolio.
- Focusing heavily on capital growth looks like the best ‘bang for your buck’ strategy if you’re just seeking 1 or 2 properties over a long period of time.
References
Trading Economics: rent inflation
DISCLAIMER: This is not Financial Advice. We also make no ascertations of the accuracy of the information herein. You must not rely on the information in the report as an alternative to financial advice from an appropriately qualified professional. If you have any specific questions about any financial matter you should consult an appropriately qualified professional. We do not represent, warrant, undertake or guarantee that the use of guidance in the report will lead to any particular outcome or result. The content, calculations and opinions contained in this article are of the writer only, and are not necessarily those of Blue Fox Finance.


